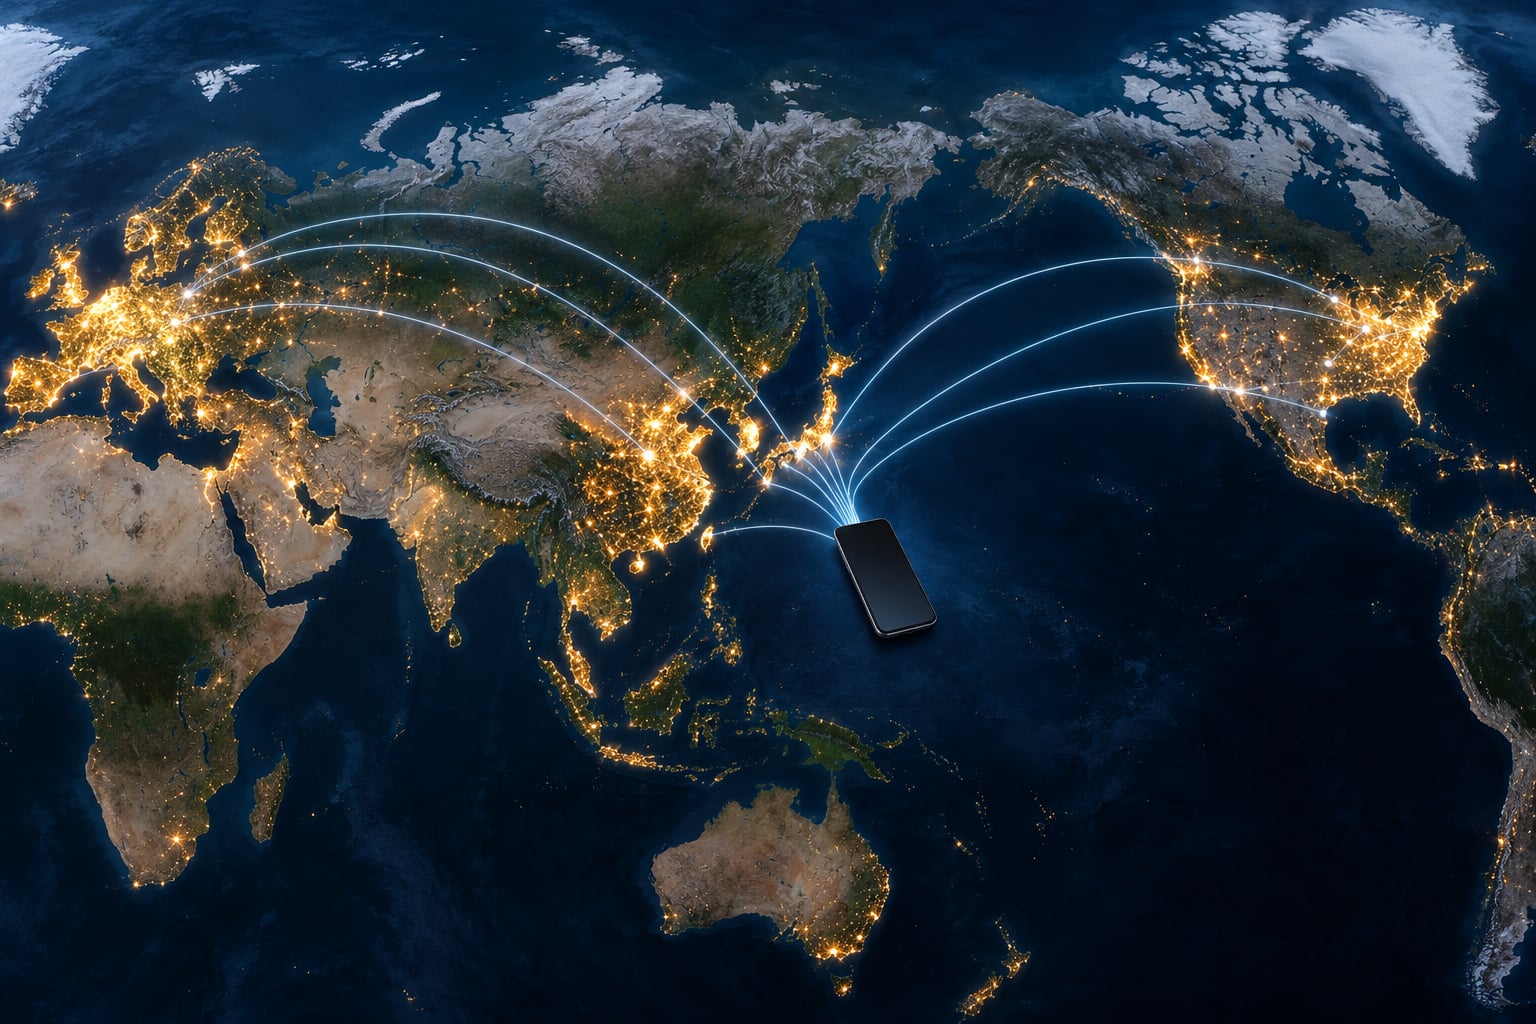
Japan sits in the top tier of 5G markets: its four networks reach almost every resident, and Opensignal has ranked the United States and South Korea alongside Singapore at the top for 5G Coverage Experience. The catch is that Japan’s headline 5G availability percentage looks modest, because operators built on Sub-6 spectrum rather than millimeter wave. In practice, Japanese 5G coverage compares best with South Korea and the US on city-center experience and rail tunnels, and worst on peak raw speed and remote land.
About the data: every figure below comes from third-party measurement — Opensignal reports, Japan’s Ministry of Internal Affairs and Communications (MIC) coverage disclosures and GSMA coverage maps — plus a two-week eSIM field test conducted in Sapporo. Nothing here is our own lab testing. Figures are dated, because network data moves quickly; check the operator’s own map for anything mission-critical.
Table of Contents
- How Japanese 5G Coverage Compares at a Glance
- What Does 5G Coverage Actually Mean?
- Population Coverage and Geographic Reach
- Urban Speeds and Network Performance
- Rural Coverage, Islands and Hard-to-Reach Areas
- 5G Availability Indoors and in Crowded Venues
- Which Country Has the Best 5G Coverage?
- What This Means for Travelers, Businesses and Tech Readers
- Frequently Asked Questions
- Conclusion: What to Check First
How Japanese 5G Coverage Compares at a Glance
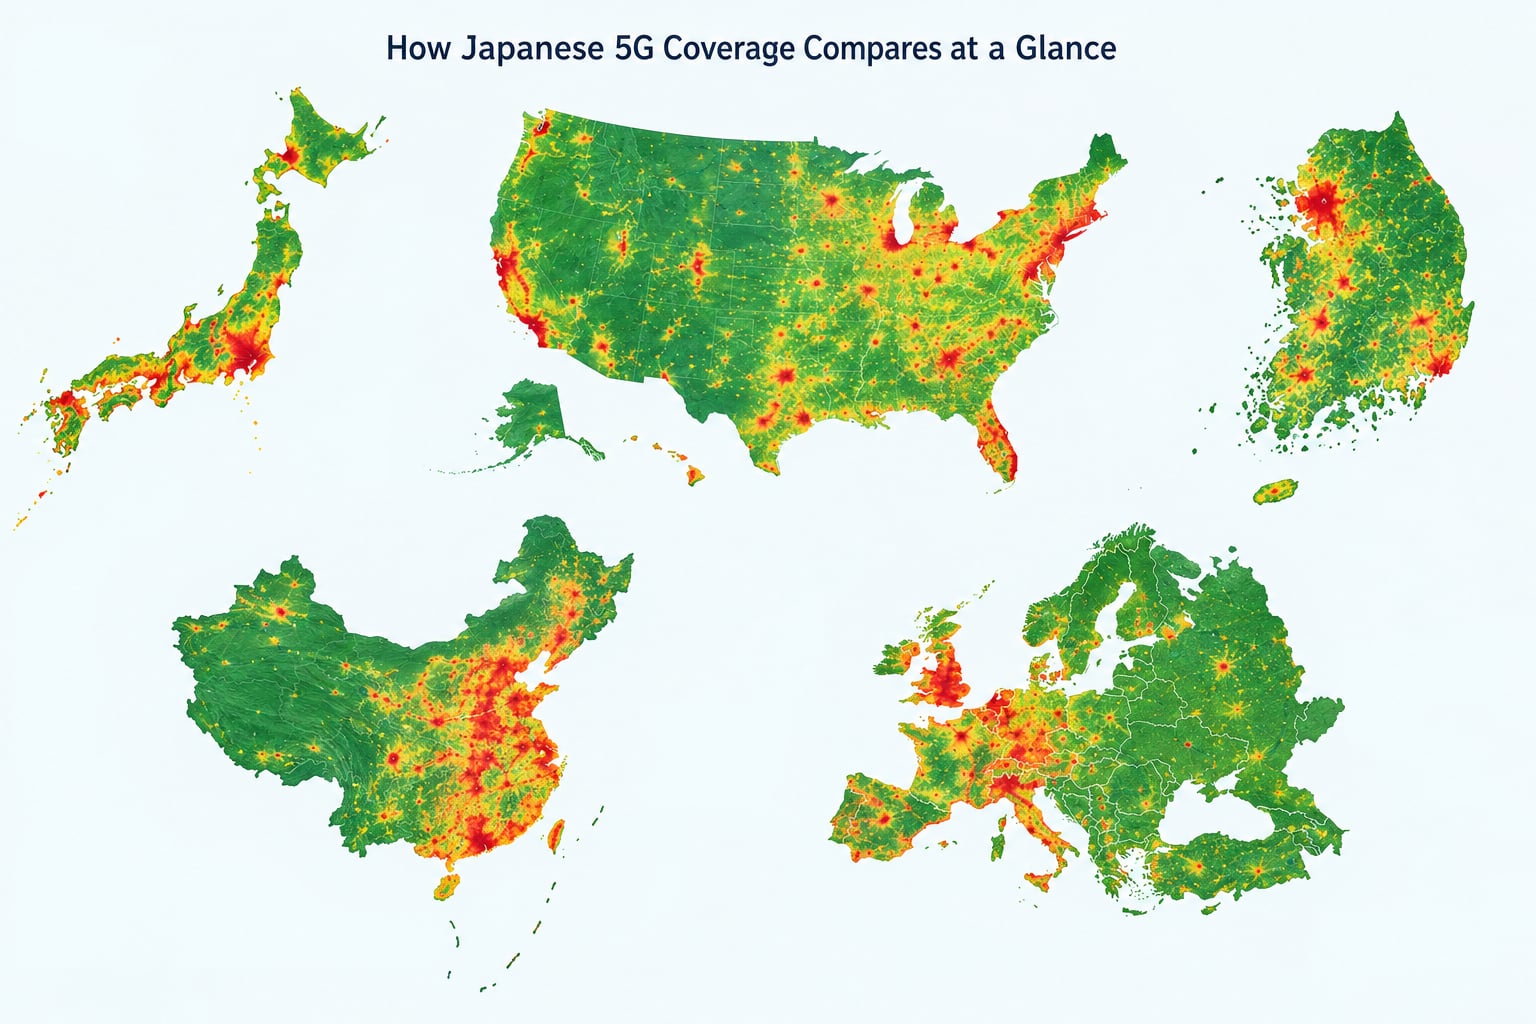
Here is the honest one-glance answer. Coverage should be read as access for people, not paint on a map of land, and that single choice explains most of the apparent differences between these markets.
| Measure | Japan | South Korea | United States | China | European leaders (DE, FR, ES) |
|---|---|---|---|---|---|
| 5G availability (Opensignal, time users are on 5G) | 26.5% to 38.4% depending on carrier (Japan report, April 2025) | High, among the fastest-growing 5G user bases | Rising quickly since the 2022 refarm of legacy bands | Very high, the largest 5G subscriber base by volume | Varies widely; Germany and Spain lead on 5G standalone |
| 4G LTE population coverage | About 99.9% (MIC) | Near-universal | Near-universal but patchy in rural blocks | Near-universal | Near-universal |
| Median download speed, all users | 50.5 to 62.1 Mbps by carrier | Typically higher than Japan on 5G | Comparable median, huge regional spread | High mid-band capacity | Behind South Korea, ahead of parts of the US |
| 5G Coverage Experience score | Top tier alongside the US, South Korea and Singapore | Top tier | Statistically tied with Singapore for the top score | Not consistently scored by Opensignal | Mid-table |
| Weak spot | Mountains, remote islands, inland valleys | Dense cities, limited 5G in older regions | Rural and indoor dead zones between cities | Rural west and south | Rural east and interior |
Two entries deserve a warning label. Availability and Coverage Experience are different measurements produced by different methodologies, and neither one is a speed test. Operators also report their own coverage percentages, which are not interchangeable with Opensignal figures or with GSMA maps — treat any table, including this one, as a starting point rather than a contract.
What Does 5G Coverage Actually Mean?
Five different things get called “coverage,” and mixing them up is the reason arguments about which country is ahead never settle.
Population coverage versus geographic coverage
Population coverage counts the share of people who can get service. Geographic coverage counts the share of land. Japan’s habitable land is heavily concentrated along a coastal corridor, so a network can reach nearly every resident while leaving most of the mountain interior unserved. Read that way, the US and China both look weaker on population coverage than Japan and far weaker on land area.
Outdoor versus indoor availability
A bar on your phone at street level does not promise the same thing two floors up in a concrete office or under a train station concourse. High-frequency Sub-6 bands carry a lot of data and fade quickly through walls and earth. Japanese carriers handle this with indoor small cells and repeaters in stations and airports, which works well in the core cities and much less well in a rural inn.
Availability versus Coverage Experience
Opensignal’s 5G Availability is the share of measurement sessions where a device was actually on a 5G connection. 5G Coverage Experience scores how reliably a user stayed on 5G when a 5G network was available. Japan scores in the top group on the second measure while looking ordinary on the first, which is the single most confusing fact in cross-country 5G comparisons.
Usable 5G versus nominal 5G
A device can attach to 5G, show full bars and still deliver a mediocre result. That happens with band combinations a phone does not support, with carrier aggregation that falls back mid-transfer, and with resold eSIM traffic that is routed abroad. Speed is a separate dimension from coverage, and you have to test it separately.
Population Coverage and Geographic Reach
Japan’s 4G population coverage sits at roughly 99.9% according to MIC, and every operator matches that near-universal claim for LTE. That is the baseline on which 5G improvements are measured: the interesting question is how fast the new layer lands on top of an already saturated network.
South Korea and Japan are structurally similar in one respect — mountainous, densely populated corridors rather than wide-open sprawl — so both reach their residents quickly. The US inverts that: population coverage is high in the cities that hold most people, but the gap between metro areas and rural counties is measured in tens of millions of people. China’s scale is unmatched in subscriber numbers, yet the same interior-versus-coastal split shows up in its western and southern provinces.
Where Japan genuinely leads is density of small cells. Tokyo, Osaka, Nagoya, Fukuoka and the corridors between them carry enough radio infrastructure that 5G is the default network rather than a special case. Where it lags is land: rural Hokkaido, the interior of Shikoku, the mountain valleys of Tohoku, the Japanese Alps around Kamikochi and the trail routes of the Kumano Kodo all fall back to LTE on any network except a well-planned NTT Docomo plan.
Urban Speeds and Network Performance
Median download speed in Japan runs from about 50.5 Mbps on one carrier to 62.1 Mbps on another, per Opensignal’s Japan report from April 2025. Those are solid numbers that would impress almost any market, and they are also roughly the numbers you get on a good 4G day.
South Korea is the market to watch for raw speed. It deployed 5G early, on wide bandwidth, in a country small enough to cover densely. China has the largest capacity in the world and aggressive mid-band build-out. The US has the widest spread between excellent and poor, because carrier-by-carrier geography differs so much.
What Japan does better than any of them is consistency in motion. Trains, subways and tunnels are the practical proof. Passengers report consistent data through the Shinkansen and the Tokyo and Osaka metro lines, which is a harder engineering problem than peak speed in a plaza. One recurring complaint from users is peak-hour slowdown in dense tourist cities such as Kyoto, where Docomo speeds drop during the evening rush.
Latency and the routing trap
A field test in Sapporo produced roughly 90 Mbps down and 8 Mbps up on an eSIM that never left LTE, with latency that felt foreign. The same test showed cheap eSIM providers routing traffic through servers in Singapore, Hong Kong or China. Bandwidth was fine; round-trip time was not. It is the clearest example of why a coverage comparison alone does not predict how a connection feels.
Rural Coverage, Islands and Hard-to-Reach Areas
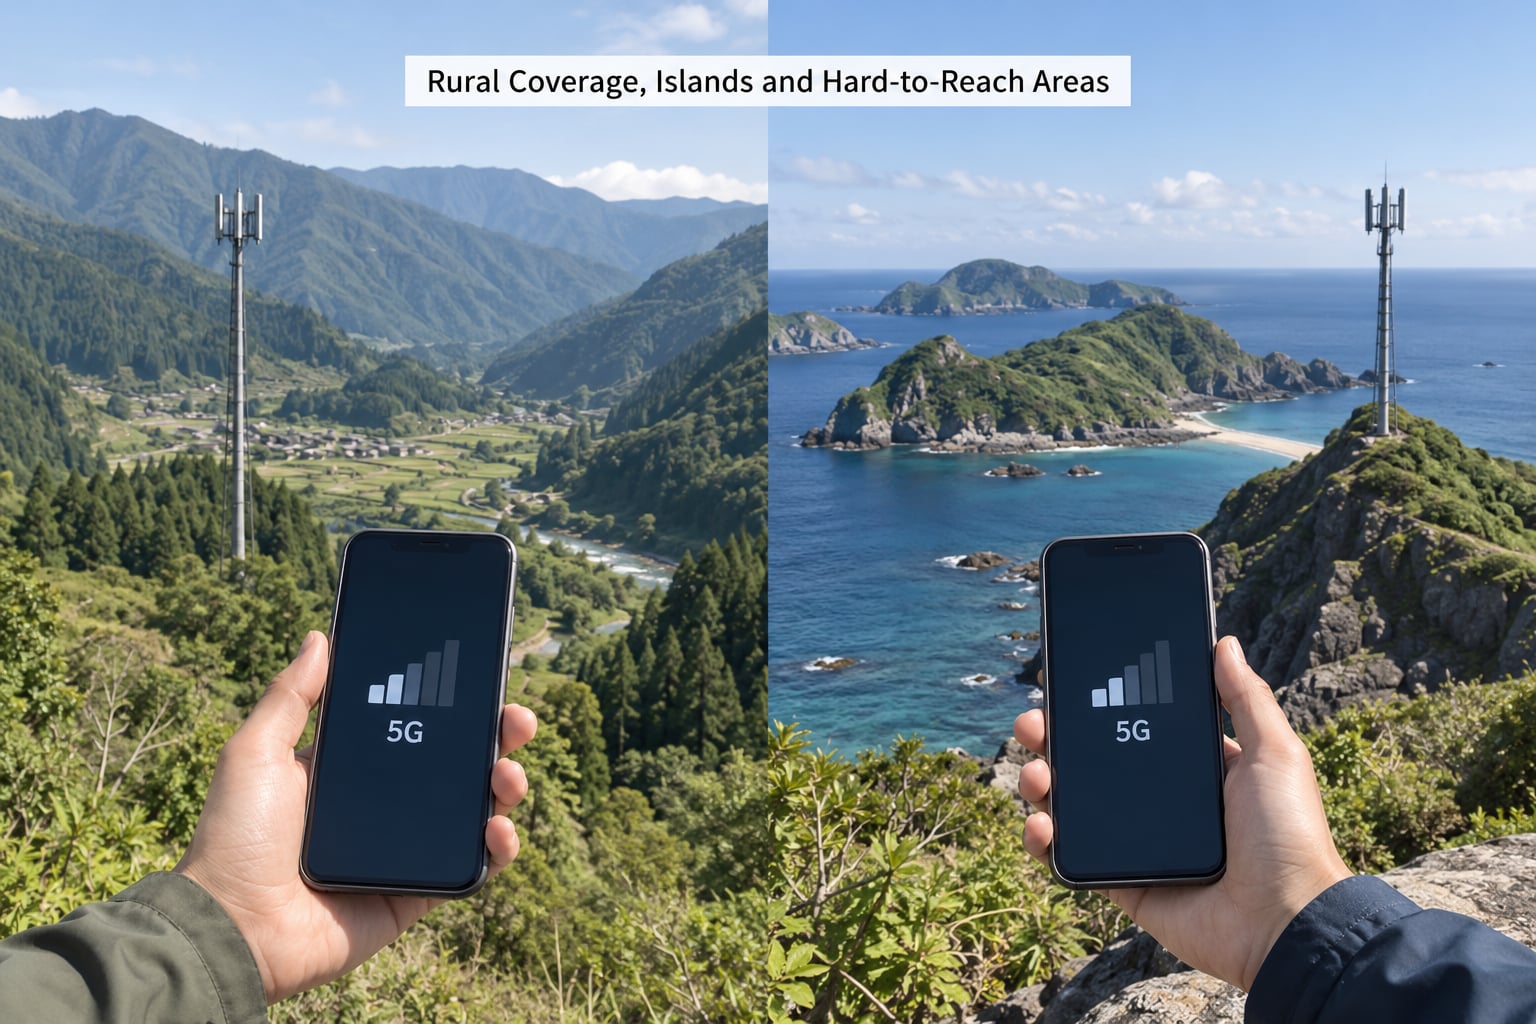
No national market provides uniform 5G service everywhere, and Japan is no exception. The failure mode is predictable: terrain, low population density and thin backhaul. A single site covering a valley floor does nothing for the ridge above it.
Named weak spots that come up repeatedly in coverage guides and traveler forums include Yakushima, the Kumano Kodo trail in the Kii Peninsula, the Japanese Alps around Kamikochi, rural Shikoku, and the road corridors across Hokkaido outside Sapporo. On these routes, assume LTE on a Docomo plan and nothing better on SoftBank or KDDI, and plan downloads before you set off.
The trade-off each market makes is different. China accepted larger low-band coverage and accepted slower peak speeds in exchange for reach. The US has historically favored capacity in metros, which leaves rural gaps that persist for years. Japan’s operators chased mid-band spectrum and densification, which buys excellent city coverage while leaving the interior on LTE. For a hiker, that choice matters more than any national ranking.
5G Availability Indoors and in Crowded Venues
Stadiums, airports and department-store districts in Tokyo and Osaka are the places where Japanese 5G performs at its most convincing, because capacity has been engineered for exactly those crowds. Underground stations are the harder case: carriers have added repeaters along most metro routes, yet some deep platforms and older sections still hand you LTE.
Apartment living in Japan is usually well served, with 5G reaching most mid-rise and newer high-rise units. Older concrete buildings on a single carrier may sit at 4G. If you are choosing a Japanese network for a fixed address, check the carrier’s coverage map for the building, then confirm with the landlord which carriers are permitted in the property.
Foreign handsets add another wrinkle. Physical North American and Korean phones sometimes fail to attach to Japanese 5G bands, and VoLTE registration issues can block calling entirely. People on r/JapanTravelTips and r/japanlife repeatedly recommend checking band and VoLTE support before the trip rather than at the airport counter.
Which Country Has the Best 5G Coverage?
There is no universal winner, because each market leads on a different measure. South Korea leads on raw speed and early adoption. The US and Singapore score highest on Opensignal’s 5G Coverage Experience, and the US is competitive on median speed. China leads on subscriber volume and total capacity. Japan leads on consistency inside dense cities and along rail infrastructure, and on the reliability of the LTE fallback underneath.
For a traveler, Japan’s balance is the deciding factor: fast where you spend your time, and rarely disconnected when you leave it. For a resident, the Docomo-versus-SoftBank-versus-KDDI choice matters more than any national comparison. For a business covering warehouses, ports, factories or event venues, coverage at those specific addresses is the only number that counts.
Is Japan running 5G or 6G?
5G, with 6G in the planning and trial phase. Japan is using Sub-6 5G commercially now, and operators and the government are working toward a 6G target around the end of the decade, with trial networks and research programs ahead of it. Nothing you can buy today runs on 6G, so any travel or purchasing advice for 2026 should be written around 5G band compatibility.
What This Means for Travelers, Businesses and Tech Readers
For a short trip, buy data in advance on the network that matches your route, and check whether the plan is 5G-capable at all rather than trusting the marketing label. A cheap eSIM that lands on LTE is still perfectly usable, as the Sapporo test showed, but one routed abroad will feel sluggish for calls and games.
For a longer stay, pick the carrier by geography. Docomo is the safe pick for mixed city and rural itineraries, KDDI performs well in cities, SoftBank tends to post the fastest urban numbers, and Rakuten Mobile is still expanding and largely depends on roaming onto KDDI outside its own footprint.
For businesses, stop reading national averages and test the specific sites. Upload to a carrier’s official coverage map at each warehouse, port or venue, then verify on site with the device model you actually deploy. Bands, VoLTE and carrier aggregation all matter more than a percentage on a slide.
Frequently Asked Questions
Does Japan have better 5G coverage than the United States?
It depends on the measure. Japan reaches about 99.9% of residents on 4G and layers dense 5G over the biggest cities, while the US has larger gaps between metros and rural counties. Opensignal has ranked the US statistically tied with Singapore at the top for 5G Coverage Experience, so the US leads on that score while Japan leads on in-city consistency.
Is Japan’s 5G network faster than South Korea’s?
Generally no. South Korea deployed 5G early on wide bandwidth in a small, dense country, and it usually posts higher median and peak speeds than Japan’s 50 to 62 Mbps range. Japan compensates with consistency rather than peak throughput, holding usable speeds through tunnels, metro lines and rail routes where faster networks often fall back.
What is the difference between 5G coverage and a 5G speed test?
Coverage answers whether a 5G signal is available at all. A speed test answers how fast data moves right now on the band and device you happen to be using. Opensignal’s 5G Availability and 5G Coverage Experience are separate measurements of the first question, and a fast speed test in a single spot says nothing about the next valley you drive into.
Can I use my foreign 5G phone in Japan?
Usually, but not always. Your handset needs to support the Japanese Sub-6 bands, and VoLTE must be enabled for calling, particularly on physical SIMs from North America and Korea. Resold eSIM plans are the most common source of surprise, since traffic is often routed through servers abroad or the plan is LTE-only despite the 5G label.
How much of Japan is expected to have 5G coverage in the future?
Operators have committed to extending 5G well beyond current urban cores, and Japan’s 4G network already covers about 99.9% of residents, so the infrastructure to carry 5G is largely in place. Terrain still sets limits in mountains, remote islands and inland valleys, and expectations for remote routes should assume an LTE fallback for the foreseeable future.
Conclusion: What to Check First
If you are asking how Japanese 5G coverage compares, the short version is that Japan trades headline numbers for reliability: slower than South Korea at peak, stronger than most markets inside cities and on trains, and thinner than national maps suggest in mountains and on remote islands.
So check the exact address and the exact device before you commit. Travelers should confirm band and VoLTE support and whether the plan is truly 5G or quietly LTE with abroad-routed traffic. Businesses should test each site on the hardware they deploy. Residents should pick on geography, with Docomo as the broad-coverage default.
One more step is worth more than any comparison table: run a real speed test at the location and time of day you care about, on the SIM you will actually use.