Japanese mobile game revenue is the money players spend inside mobile games in Japan, mostly on in-app purchases of characters, costumes and items, minus what the app stores, taxes and payment providers take away before the publisher is paid. Estimators put Japan’s annual in-app purchase market at roughly 11 billion USD, which makes it one of the most valuable mobile game markets on the planet relative to its size. This guide explains where those numbers come from, why two websites often disagree about the same game, and how to read any Japanese mobile game revenue figure you come across.
The confusing part is rarely the size of the market. It is that the phrase covers at least four different things: what players pay, what the store takes, what the publisher books as income, and what an outside analyst guesses. Once you know which one you are looking at, the figures stop being mysterious.
Table of Contents
- 1What Is Japanese Mobile Game Revenue?
- 2How Is Japanese Mobile Game Revenue Calculated?
- 3How Japanese Mobile Game Revenue Is Calculated
- 4How Much Does the App Store Keep?
- 5What Are the Main Japanese Mobile Game Revenue Streams?
- 6Why Do Japanese Game Revenue Estimates Differ?
- 7How Do Analysts Estimate Revenue for Japanese Games?
- 8How Should You Read a Japanese Mobile Game Revenue Figure?
- 9Frequently Asked Questions
- 10Is Japanese mobile game revenue usually reported before or after app-store fees?
- 11Why can two websites show different revenue estimates for the same Japanese mobile game?
- 12Does a high ranking in Japan’s App Store necessarily mean a game earns more revenue?
- 13How are taxes and payment-processing fees reflected in a game publisher’s revenue?
- 14What is the difference between Japan-only revenue and a game’s worldwide mobile revenue?
- 15Can readers calculate a game’s likely revenue from its chart position alone?
- 16What to Do First With a Revenue Number
What Is Japanese Mobile Game Revenue?
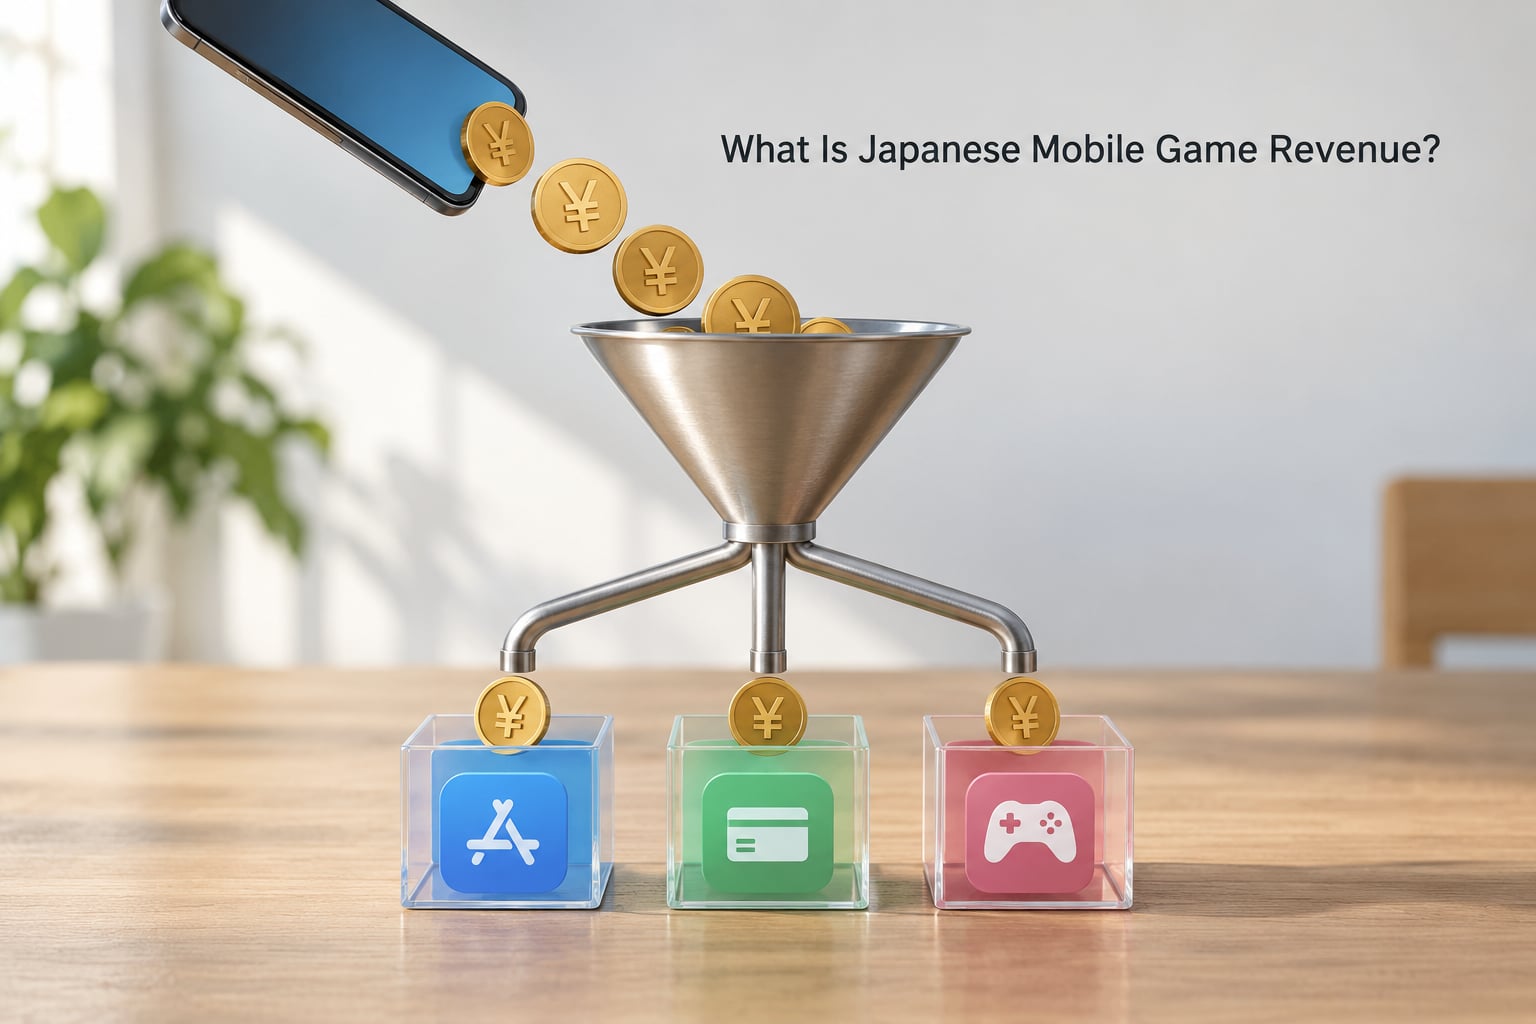
Japanese mobile game revenue means the total income generated by mobile games played in Japan, and the vast majority of it comes from in-app purchases. Players pay real yen to a phone, the platform handles the payment, and the developer receives a share. Advertising, paid downloads and licensing make up a much smaller slice in Japan than they do in North America, where free-to-play ad models are far more common.
Two things make this market stand out. Japan is roughly the third-largest gaming market in the world by revenue, and the gap between its population and its spending is unusually wide. The second is genre concentration: RPG titles account for about 37.4 percent of mobile game revenue in Japan and strategy games for about 21.8 percent, so two genres carry close to 60 percent of the market. Puzzle games dominate downloads, but they earn far less per install.
Japan is also disproportionately important to anime-style games. Around 42 percent of worldwide in-app purchase revenue for anime-style mobile games comes from Japan, and roughly 34 percent of global otome game revenue does too. That concentration is why Japanese publishers treat the domestic market as a core business rather than a side project.
So why do figures for the same game contradict each other? Because the word revenue can mean gross consumer spending, the store’s cut, the publisher’s net receipts, or a modelled guess that approximates one of those. Add tax treatment, exchange rates and different time windows, and the same title can legitimately show three very different totals in one week.
How Is Japanese Mobile Game Revenue Calculated?
How Japanese Mobile Game Revenue Is Calculated
The calculation runs in a fixed order, and every step subtracts from the one before it. Start with gross bookings, take the platform commission, remove consumption tax and payment costs, then add advertising and subtract any other deductions. What survives is what a publisher would call net revenue for that period.
- Gross bookings. Everything players actually paid, before anyone takes a cut. This is the number most charts and third-party estimators work from.
- Platform commission. The fee the app store deducts before passing funds to the developer. Rates vary by program and by how long a subscription has been running.
- Consumption tax. Japanese consumption tax applies to digital goods, and treatment differs between platform billing and payment processed outside the store.
- Payment and processing costs. Card fees, carrier billing charges and store payment handling costs.
- Advertising revenue. Ad impressions and rewarded video, usually far smaller than in-app purchases for Japanese titles.
- Other deductions. Marketing spend, midseason promotions given back as free currency, refunds and chargebacks.
Here is a worked example using clearly fictional numbers. Suppose a Japanese role-playing game takes 100 million USD in gross bookings during a year. After a blended store commission, 20 million goes to the platform. Consumption tax and payment costs take a further 8 million. The publisher adds 3 million from advertising and subtracts 5 million in promotions and chargebacks. The result is roughly 70 million USD of net revenue for the year.
That 30 percent gap between gross and net is the single most useful thing to keep in mind. Any two sources quoting the same title are often quoting different points on that chain.
How Much Does the App Store Keep?
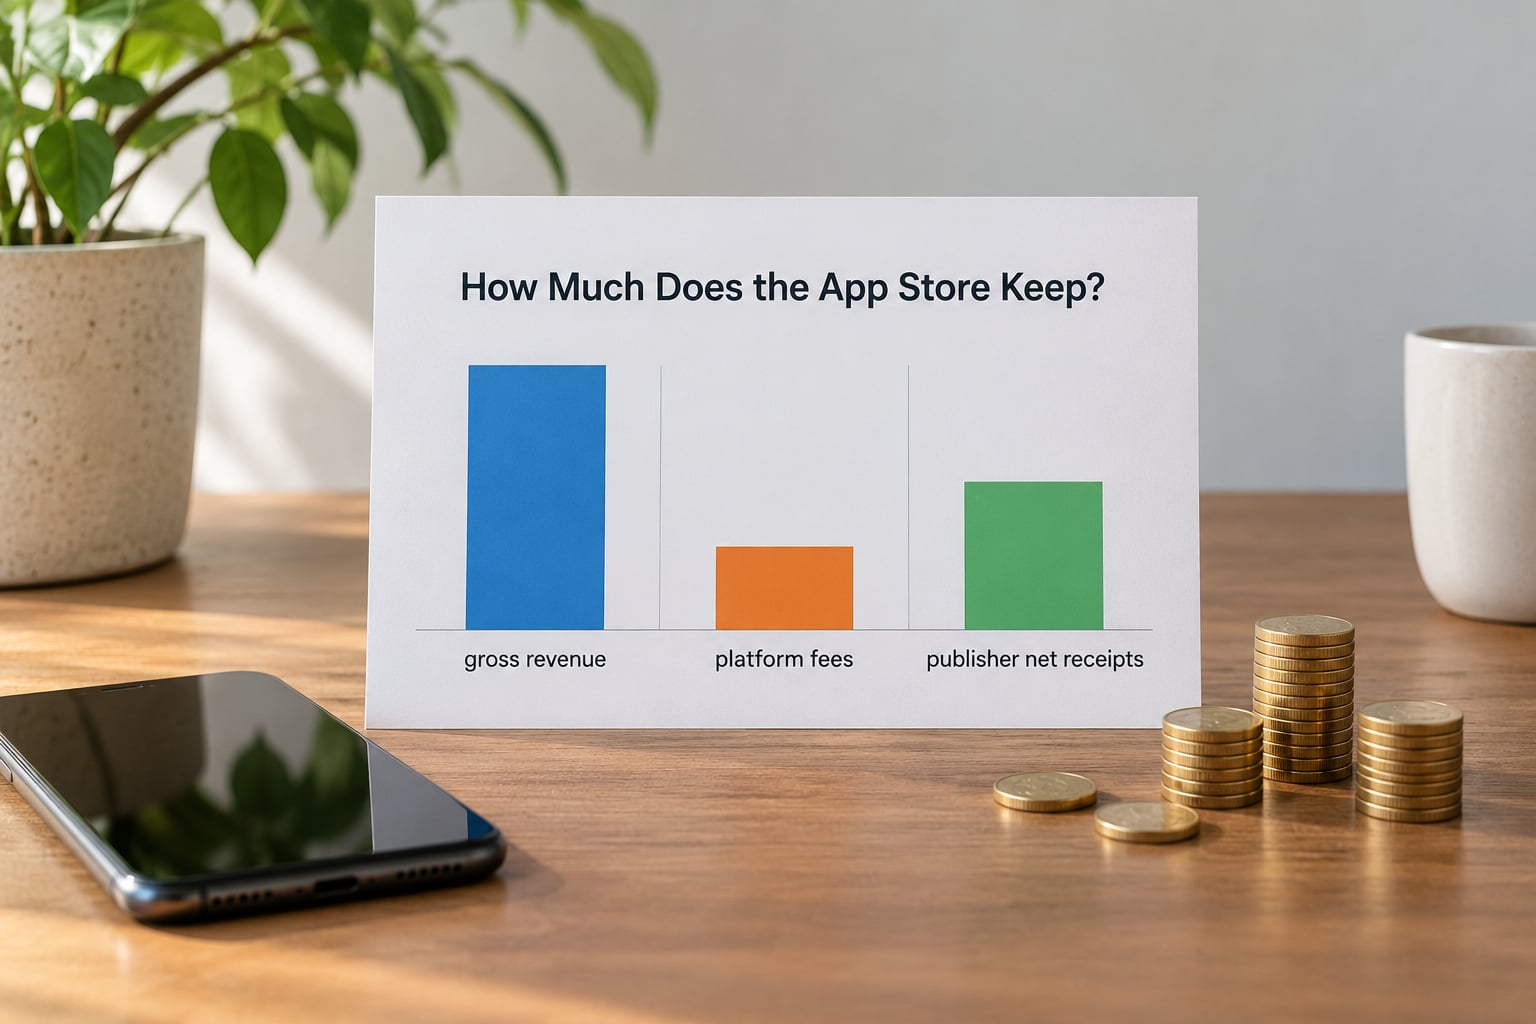
There is no single universal percentage, and anyone who quotes one flat rate for all stores is oversimplifying. Apple’s App Store and Google Play both use tiered structures: the highest rate applies to the first year of a subscription, and lower rates kick in afterward, with additional reduced tiers available through small developer and subscription programs. Most of the games that dominate Japanese charts qualify for the lower tiers, so their effective take is well below the headline number.
Games in Japan are also affected by regional pricing, promotional periods and the difference between store billing and payment through an alternative provider. A studio that routes payments around the store can change its effective cost per sale, which in turn changes the gap between its gross and net figures. When a chart shows a spike, the underlying assumption about take rate may have shifted too, not just player spending.
For a reader trying to size a market, the practical takeaway is this: treat net revenue as a range, not a point. A commonly cited band for blended commercial terms runs from 15 to 30 percent of gross, and where a specific game sits inside that band depends on its monetization mix and its store agreements.
What Are the Main Japanese Mobile Game Revenue Streams?
Most Japanese mobile game revenue arrives through one of six channels, and the mix differs sharply from Western markets.
| Revenue stream | How it works in Japan | Share of typical revenue |
|---|---|---|
| In-app purchases | Character draws, costumes, stamina items, bundles | Dominant source |
| Limited-time banners and events | Short availability windows that concentrate spending into a few days | Large share of in-app purchases |
| Subscription passes and battle passes | Recurring seasonal rewards bought once per season | Growing steadily |
| Paid app downloads | A premium upfront price, common for premium role-playing titles | Small, shrinking |
| Advertising | Rewarded video and banner ads, more common in casual titles | Minor in Japan, larger elsewhere |
| Licensing and merchandise | Anime adaptations, figures, concerts, collaborations | Off-platform, rarely in chart data |
Crossovers deserve a special mention because they move revenue in ways charts struggle to explain. A collab with a popular anime franchise or a surprise pairing between two rival studios can multiply daily revenue many times over for a short window. One industry report documented a single event driving revenue to more than ten times a title’s normal baseline, then fading within weeks. Annual events tied to story anniversaries follow the same pattern.
Spending is also heavily concentrated. Industry analysts and the player community both note that a small share of paying users generates a large share of revenue, which is why teams design pity systems, guaranteed drops and spending tiers around a hard core of very heavy spenders. That concentration is also why one weak month can look like a collapse.
Why Do Japanese Game Revenue Estimates Differ?
When two sources report different revenue for the same Japanese mobile game, one of them is usually measuring a different thing. The usual reasons:
- Time window. A 12-month rolling total, a calendar-year figure and a single-month number are not comparable.
- Geography. Japan-only revenue and worldwide revenue diverge sharply for domestic titles. Community trackers often report Japan as a multiple of the global figure for Japan-exclusive games.
- Gross versus net. One source models consumer spending, another models publisher receipts.
- Platform coverage. Google Play, third-party Android stores and PC storefronts are included by some sources and excluded by others.
- Exchange rates. Reports converted to US dollars move with the yen even when yen spending is flat.
- Tax treatment. Consumption tax handling differs by billing route, and how a source treats it changes the total.
- Reporting lag. Publisher disclosures appear months after the period they cover, so the newest month is usually an estimate rather than a fact.
- Modelling. Outside estimators build a model from download data, rankings and regional spending indices. Two models can diverge by a wide margin on the same title.
The player community is blunt about this. Monthly revenue tracking threads on Reddit are a fixture in gacha gaming circles, and the most common question in them is whether the estimated numbers match what players actually see in their spending reports. The answer is usually that the estimate is directionally right and imprecise in detail.
How Do Analysts Estimate Revenue for Japanese Games?
Nobody outside a publisher sees the raw numbers, so analysts build estimates from observable signals. Understanding which signal is being used tells you how much to trust the result.
Download and ranking charts. Store top-chart positions are public. Position alone is weak evidence, because a paid game can out-earn a free one on the same chart, but movement on a chart usually tracks real changes in activity.
Modelled consumer spend. Firms like Sensor Tower and data providers such as Newzoo combine download estimates, in-app purchase price points observed on device and regional spending indices to produce a gross spending figure. This is the most common source of figures you see quoted, and it is an estimate rather than a measurement.
Publisher disclosures. A listed company’s quarterly report gives real booked revenue, but it covers the whole company, all regions and often all platforms, so a single game can only be inferred from it.
Comparable titles. Analysts benchmark a new release against similar games with known performance, adjusting for launch timing, marketing spend and event cadence.
Judge an estimate by its freshness and its scope. A 12-month rolling total through mid-year from a recognised data firm is useful. A single-month number from a blog with no methodology is not.
How Should You Read a Japanese Mobile Game Revenue Figure?
Before you trust any number, run it through these seven questions:
- What period does it cover?
- Is it Japan only or worldwide?
- Which platforms are included?
- Is it gross consumer spending or net publisher receipts?
- Which currency was used, and was it converted?
- Who produced it, and is the methodology stated?
- Is it an audited disclosure, an official company report, or a model?
If a figure does not answer the first four questions, it cannot be compared with anything else. That is the whole trick, and it takes about ten seconds.
Frequently Asked Questions
Is Japanese mobile game revenue usually reported before or after app-store fees?
Both appear in circulation, which is the main source of confusion. Third-party estimators and top-grossing charts report gross consumer spending, before the app store takes its commission. Publisher reports and listed company filings show net receipts, after store fees, taxes and payment costs. A title can show 100 million USD in one source and about 70 million USD in another while being correct in both.
Why can two websites show different revenue estimates for the same Japanese mobile game?
Usually because they measure different things. The time window may differ, one figure may cover Japan only while the other covers worldwide, or one may be gross and the other net. Platform coverage, exchange rate treatment and modelling method all change the total. Always check the period, geography, platform scope and whether the figure is before or after store fees before treating a difference as a real one.
Does a high ranking in Japan’s App Store necessarily mean a game earns more revenue?
No. Chart position reflects a blend of downloads, engagement and revenue, and a paid premium title can out-earn many free downloads. A strong rank is a useful signal of activity rather than income. For revenue specifically, look for consumer-spend rankings and for a title’s pattern of limited-time event spikes, which say more about earnings than a single week’s position.
How are taxes and payment-processing fees reflected in a game publisher’s revenue?
They are deductions between gross and net. Japanese consumption tax applies to digital goods, and the treatment depends on whether the purchase is billed through the app store or through another payment route. Card, carrier billing and store processing costs come off as well. Gross consumer spending figures from chart providers normally leave these costs in, so they run higher than what a publisher reports.
What is the difference between Japan-only revenue and a game’s worldwide mobile revenue?
Japan-only revenue counts spending by players located in Japan, including play by overseas visitors. Worldwide revenue adds every other market. For domestic Japanese titles the gap is enormous: community trackers often see Japan revenue at a multiple of the global figure for games released only in Japan. Global titles run the other way, with Japan supplying a large share of revenue for anime-style and otome games specifically.
Can readers calculate a game’s likely revenue from its chart position alone?
Not reliably. A rank gives you a rough order of magnitude at best, because position blends downloads with spending and hides differences in monetization. To estimate revenue you need at least the price points of items, observed download volume and the genre’s average revenue per download in Japan. Even then the result is a range, not a figure, and it should be labelled an estimate.
What to Do First With a Revenue Number
Start with the label, not the value. Ask whether the figure is gross or net, whether it covers Japan alone, and what dates it spans. If those three answers are clear, the number is usable even if it is an estimate. If they are not, no amount of precision in the digits will help you.
After that, watch the event calendar. Japanese mobile game revenue moves in bursts tied to limited-time banners, anniversary events and franchise collaborations, and a quiet month often means a content break rather than a shrinking player base. Reading the chart alongside the event schedule is the fastest way to make sense of a spike or a dip.